Network
The Network tab presents an overview of the network topology, showing all connected devices and highlighting any errors detected within or between them.

Errors
Status
Errors detected in devices within the AVB domain are listed on the left side of the Network tab. Each error entry may be accompanied by one red error counter for the primary and one for the secondary network showing the number of devices affected by that issue. The total displayed next to the 'Status' label at the top of the window represents the combined count of all errors listed below.
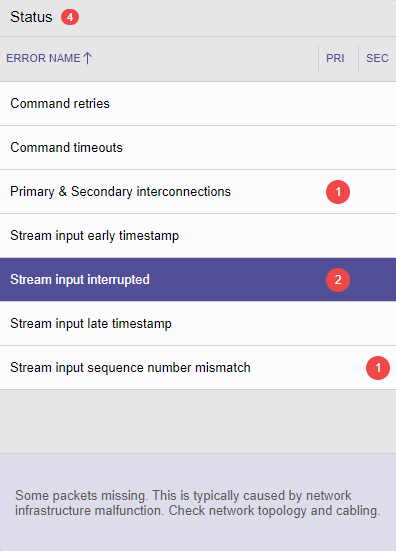
Selecting a row in the table displays a detailed explanation of the error below the list.
Graph
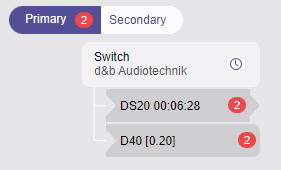
When a specific error is selected in the Status table, affected devices are highlighted in the graph view next to their device names, using a red error counter. The number shown next to each device name indicates how many streams are impacted by the issue.
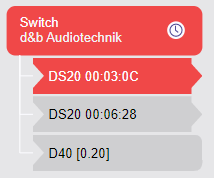
Devices affected by severe errors, such as 'Primary & Secondary interconnections,' are highlighted in red in the graph view.
Clearing Errors
Error indications are cleared by clicking the error number icon or pushing the DEL key while having either a device or error selected. Severe errors that highlight the entire device, rather than displaying a red error number, cannot be cleared within Milan Manager.
Topology
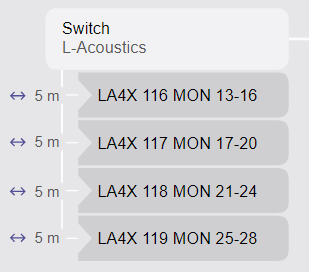
The right section of the Network tab presents a graphical representation of physical device connections, network hierarchy, bandwidth indicators, and approximate cable length estimates. Additional device details are accessible by hovering over items within the graph.
Only active connection paths, such as those established by RSTP, are visualized. Redundant or backup paths, as well as switches without connected AVB devices, are excluded from the display.
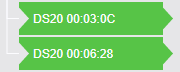
Daisy chain connections are depicted using indentation for each device.
Navigation
Zoom and scroll functionalities are available to facilitate navigation within the graph by using mouse and keyboard shortcuts.
| Functionality | Windows | macOS |
|---|---|---|
| Zoom in | CTRL + + | ⌘ + + |
| Zoom out | CTRL + - | ⌘ + - |
| Reset zoom | CTRL + 0 | ⌘ + 0 |
Approximate Cable Length
Clicking the ![]() icon in the upper right corner adds an approximate cable length to the graph. A dialog appears, allowing selection of the unit of measurement (meters or feet) or disabling the feature.
icon in the upper right corner adds an approximate cable length to the graph. A dialog appears, allowing selection of the unit of measurement (meters or feet) or disabling the feature.
Cable length is estimated using propagation delay information provided by devices. As switches do not supply this data, cable length can only be estimated between devices and the nearest switch or devices functioning as a switch.
Calculated cable lengths may differ from actual values due to tolerances and device-specific factors. Devices with internal switches or format converters (such as fiber) may result in inaccurate readings.
Device Find
The integrated 'Find device' feature streamlines the process of locating devices within the network graph.
Selecting the ![]() icon, or using the CTRL / ⌘ + F keyboard shortcut, opens a popup where a device name can be entered for search.
icon, or using the CTRL / ⌘ + F keyboard shortcut, opens a popup where a device name can be entered for search.
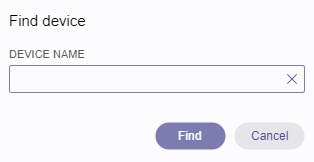
When the entered name matches multiple devices, all corresponding devices will blink green upon pressing the Find button.
gPTP Grandmaster
The ![]() icon next to a device name signifies that the device is serving as the gPTP Grandmaster for all other devices in the AVB domain (distinct from the Media Clock leader).
icon next to a device name signifies that the device is serving as the gPTP Grandmaster for all other devices in the AVB domain (distinct from the Media Clock leader).
In large networks, identifying the gPTP Grandmaster device may be challenging. Clicking the ![]() button in the upper right corner highlights the gPTP device.
button in the upper right corner highlights the gPTP device.
Zoom to Fit
To automatically adjust the zoom level and reposition the view to include all devices, press the ![]() button in the upper right corner or use CTRL / ⌘ + 0 keyboard shortcut.
button in the upper right corner or use CTRL / ⌘ + 0 keyboard shortcut.
Bandwidth Indication
The network graph displays bandwidth indicators on switch interconnects:
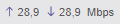
The value on the left represents outbound bandwidth, while the value on the right indicates inbound bandwidth.
Please note that these bandwidth values are estimations derived from the connected streams and their respective formats. They do not reflect actual, real-time network measurements.